|
Technical Analysis
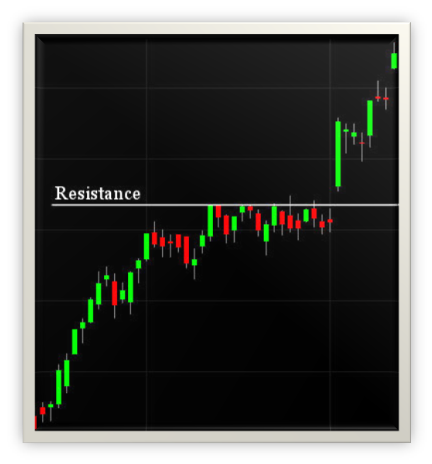
The first principle of Technical Analysis is Support and Resistance (S/R). A support level is a price level
where the price tends to find support as it is going down. This means the price is more likely to
"bounce" off this level rather than break through it. However, once the price has passed this level,
by an amount exceeding some noise, it is likely to continue dropping until it finds another support level.
The chart at the right displays classic S/R characteristics. When placing your profit target(s), you should
use S/R levels as the most likely maximum short term profit point for the trade. When there are multiple S/R levels then you can break up your trade into multiple exits
that allow you to "scale out" of the trade at
each S/R level.
Support and Resistance levels also represent the most logical opportunities in the placement of stop losses
for your trades. When an S/R level is broken in the opposite direction as your trade
(you are losing money), then you should exit
the trade. Allowances need to be made for minor breaches, which is just random noise. S/R can be worn down
when it is challenged too many times, as in the example on the right.
|
|
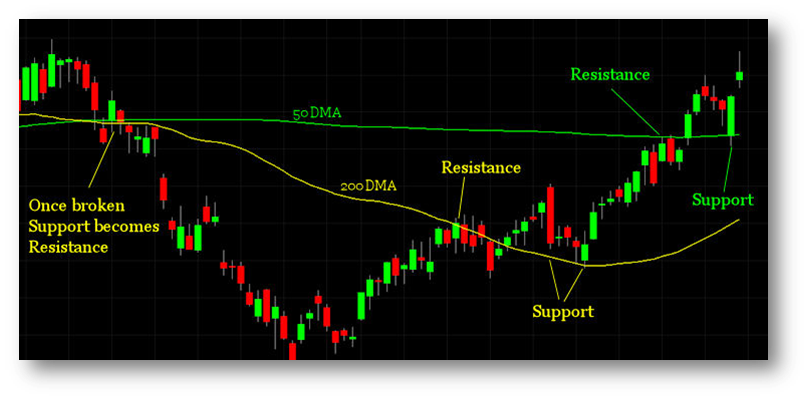
Support and Resistance levels also form around certain moving averages:
| |
| 20DMA |
Weak |
| 50DMA |
Moderate |
| 100DMA |
Moderate |
|
|
| 150DMA |
Moderate |
| 200DMA |
Strong |
| 200WMA |
Strong |
|
|
| |
DMA = Day Moving Average |
|
WMA = Week Moving Average |
|
 |
Fibonacci retracement is a pullback entry strategy that is based on the idea that markets will retrace a predictable portion of a move, after which they
will continue to move in the original direction. If the pull back is larger than the
proper "Fib" level for a retracement then it is probably
a reversal of direction rather than a temporary
pullback. Fibonacci retracement levels are very useful guides to use when
looking for entry points on a pullback. If the pullback is deeper than 38.2% then you should use caution since you may
be looking at a reversal, not a pullback.
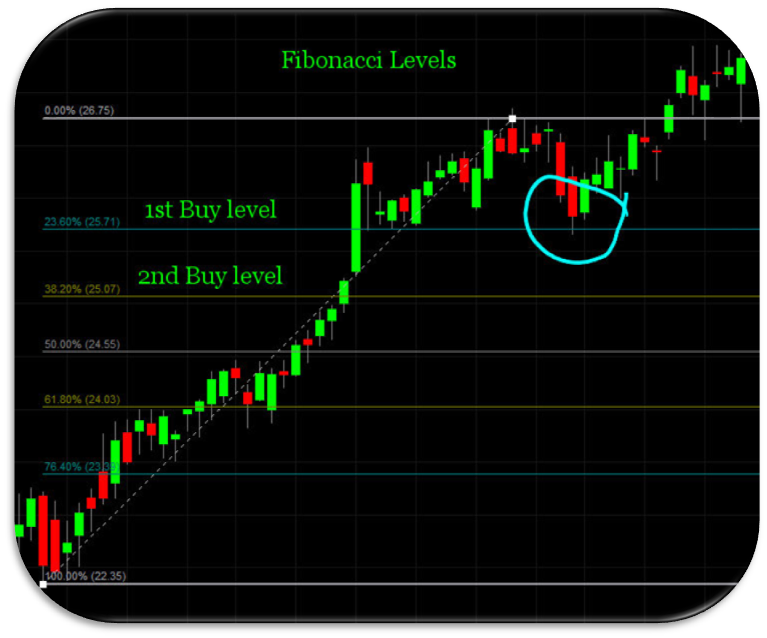
For the purposes of trading, the Fibonacci ratios that are of interest are primarily 23.6%, 38.2%, 50%, and 61.8%.
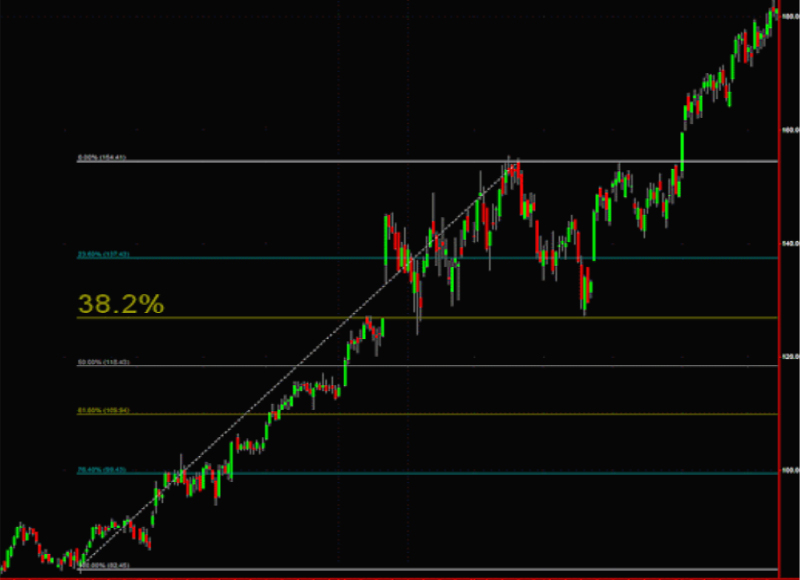
If a bullish trend retraces no more than 23.6% then it is a strong rally and should be added to.
A retracement of 38.2% is not bad and can be added to. A retracement down to
50% is still in play but the odds are less favorable. A rally that can’t hold a 50% retracement has a low probability
of resuming soon. Fibonacci retracement can be applied to both daily and intra-day charts.
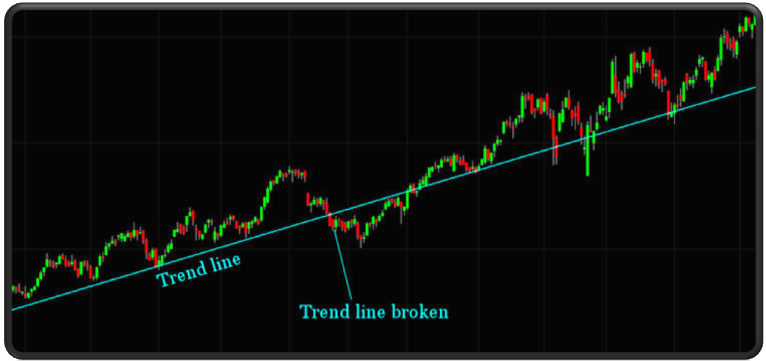
Trend lines show you the best pullback entry points in a trend. A Trend line is drawn under a rising stock and above a declining
stock. If the trend line is broken then the stock most likely needs a rest
-it should not be construed as a reversal of
direction.
Scott Tafel is the founder and principle partner in Falcon Trading Systems: computers for traders. He has
been a trader since 1999. Mr. Tafel spent 27 years working in the Nuclear power industry, principally as a
Nuclear Reactor Operator.
|

|
|