|
More on Technical Analysis
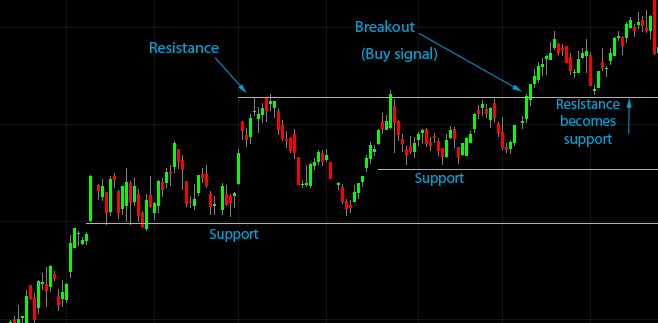 The example above shows how you would
see and trade the support and resistance level of that chart.
The example above shows how you would
see and trade the support and resistance level of that chart.
Your stop losses would be placed just below the support levels.
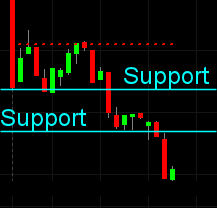
When support is broken then the price often moves
down to the next support level (see right). When you look at a chart as a
trader your eyes should first pick out the support and resistance levels. From here you start looking for
conditions where the stop loss (based on support) will be relatively small compared to the profit target
(based on resistance). For short selling, reverse everything.
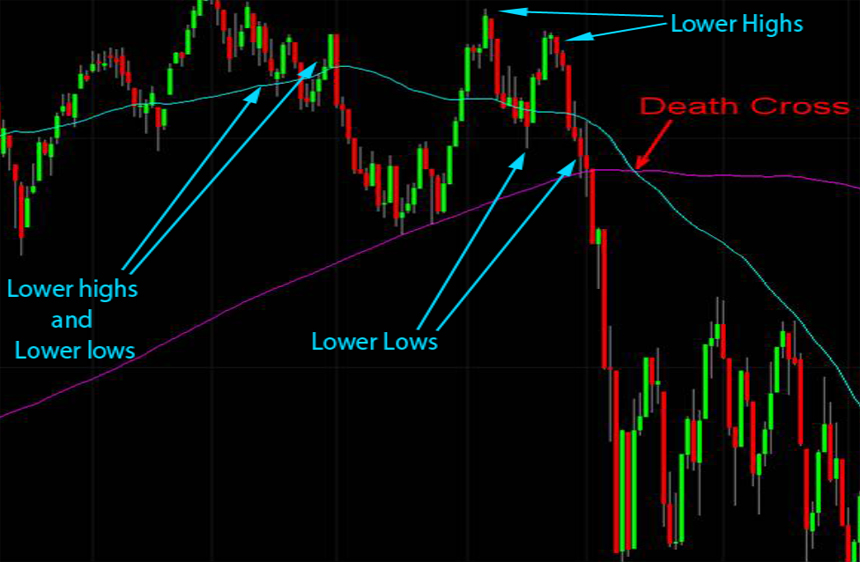
Another important piece of information that S/R tells you is the current state of the trend. When you are making higher
lows and higher highs then the trend is up. When you are making lower highs and lower lows then the trend is down.
Each higher low represents a new minor support level
and each lower high represents a new minor
resistance level. If you
are not making higher lows/highs or lower highs/lows
that make any sense then the trade is sideways and you want to sell tops and buy bottoms. A "Death Cross" is where a
medium length moving average crosses under a long term moving average. It can refer to the 50DMA crossing under the 100DMA,
the 100DMA crossing under the 200DMA, or the 50DMA crossing under the 200DMA.
It is generally considered a bearish sign but
you need to look at the Fib levels first. I don't put much stock in it
unless the Fib retracement is worse than 38.2%. A "Golden Cross" is the opposite of a Death Cross.
 |
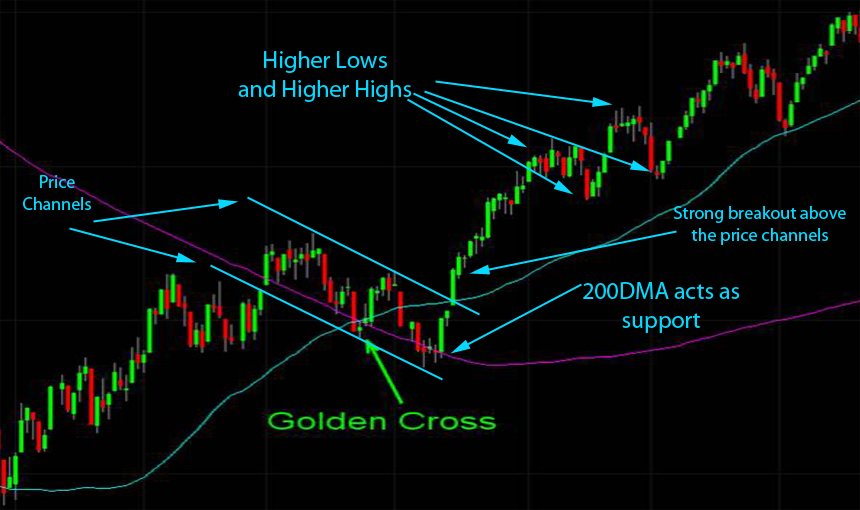 |
Price channels (above) allow you to draw a trend line above and below the price action. Unlike regular trend lines, a price channel
(where two parallel lines neatly contain the highs and lows) builds up energy for a reversal. The end of a price channel often
results in a direction reversal.
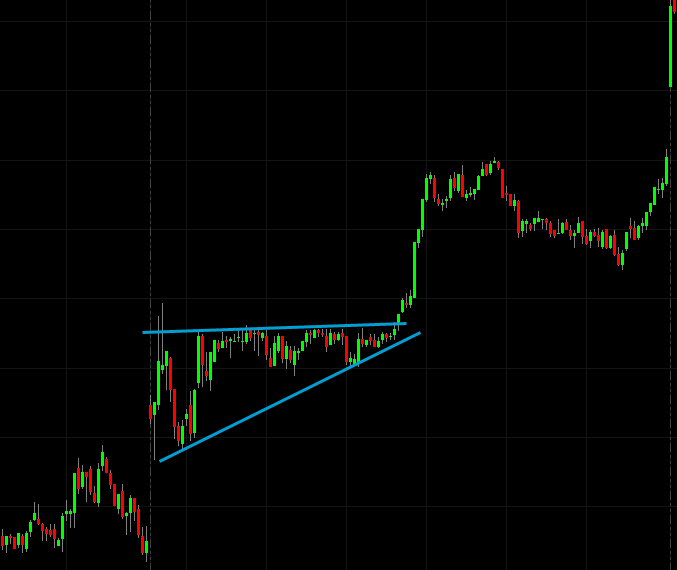
Converging trend lines are called "triangles". The triangle pattern occurs often and should be learned well
because it can become one of your
most important sources of income. They occur most often on intra-day charts, such as the one below. Triangles should not be used to trade
against the general trend of the market.
|